Macro news trading is the practice of trading around the publication of macroeconomic data that can cause a rapid repricing of currencies, gold, stock indices, and other financial instruments.
These releases include employment, inflation, economic activity, and retail sales data. However, the publication of an important report does not automatically mean that the market will make a large move.
The market primarily reacts to the difference between the published figures and participants' expectations. The direction and duration of that reaction depend not on a single number, but on the complete release, revisions to previous data, current market positioning, and available liquidity.
This article explains the complete path of a news release:
official source → news channel → data processing → trading trigger → broker → order fill or rejection.
Which Macroeconomic Releases Move the Market?
Based on our observations, the most regular short-term reactions occur around key US releases, including:
- the Employment Situation report, including Nonfarm Payrolls;
- the Consumer Price Index;
- the Producer Price Index;
- Retail Sales;
- Weekly Initial Jobless Claims;
- EIA Natural Gas Inventories.
Australian labour market and inflation data also play an important role. Releases from the United Kingdom, Canada, Germany, Japan, and New Zealand can generate market reactions as well, although their strength and consistency vary from one event to another.
This does not mean that other countries or indicators have no market impact. We are referring specifically to releases that more frequently create noticeable short-term repricing in the instruments we monitor.
The releases we track continuously, with their history and reaction profiles, are listed under economic reports.
For example, the US Employment Situation report is published by the Bureau of Labor Statistics and combines the results of two monthly surveys. It includes not only the change in payroll employment, but also unemployment, earnings, average weekly hours, and revisions to previous months. See the BLS Employment Situation archive.
In Australia, the official Labour Force report is published by the Australian Bureau of Statistics. It includes employment changes, the unemployment rate, labour force participation, hours worked, and other indicators. See Labour Force, Australia.
What Do Actual, Forecast, and Previous Mean?
Before an economic report is published, banks, research organisations, and independent analysts produce their own estimates.
Economic calendar providers collect these estimates and calculate a general market expectation known as the consensus forecast.
An economic calendar normally displays three values:
- Actual — the figure published in the official release;
- Forecast — the analysts' consensus estimate;
- Previous — the value reported for the previous period.
The forecast is not an official figure produced by the government agency. It is a third-party estimate of what the market expects the result to be.
For this reason, the published number alone is not enough. Its deviation from expectations also matters.
Surprise = Actual − Forecast
When the actual value differs significantly from the forecast, market participants may have to reprice currencies, interest-rate expectations, and related assets very quickly.

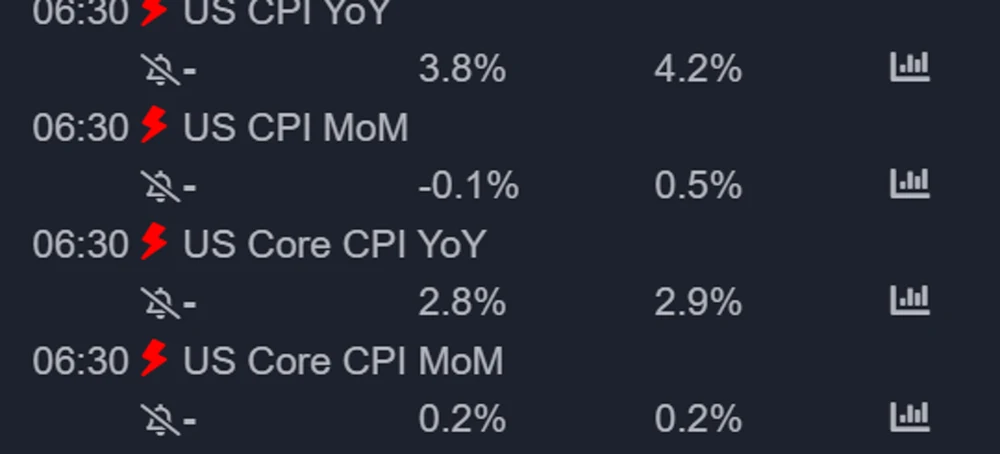
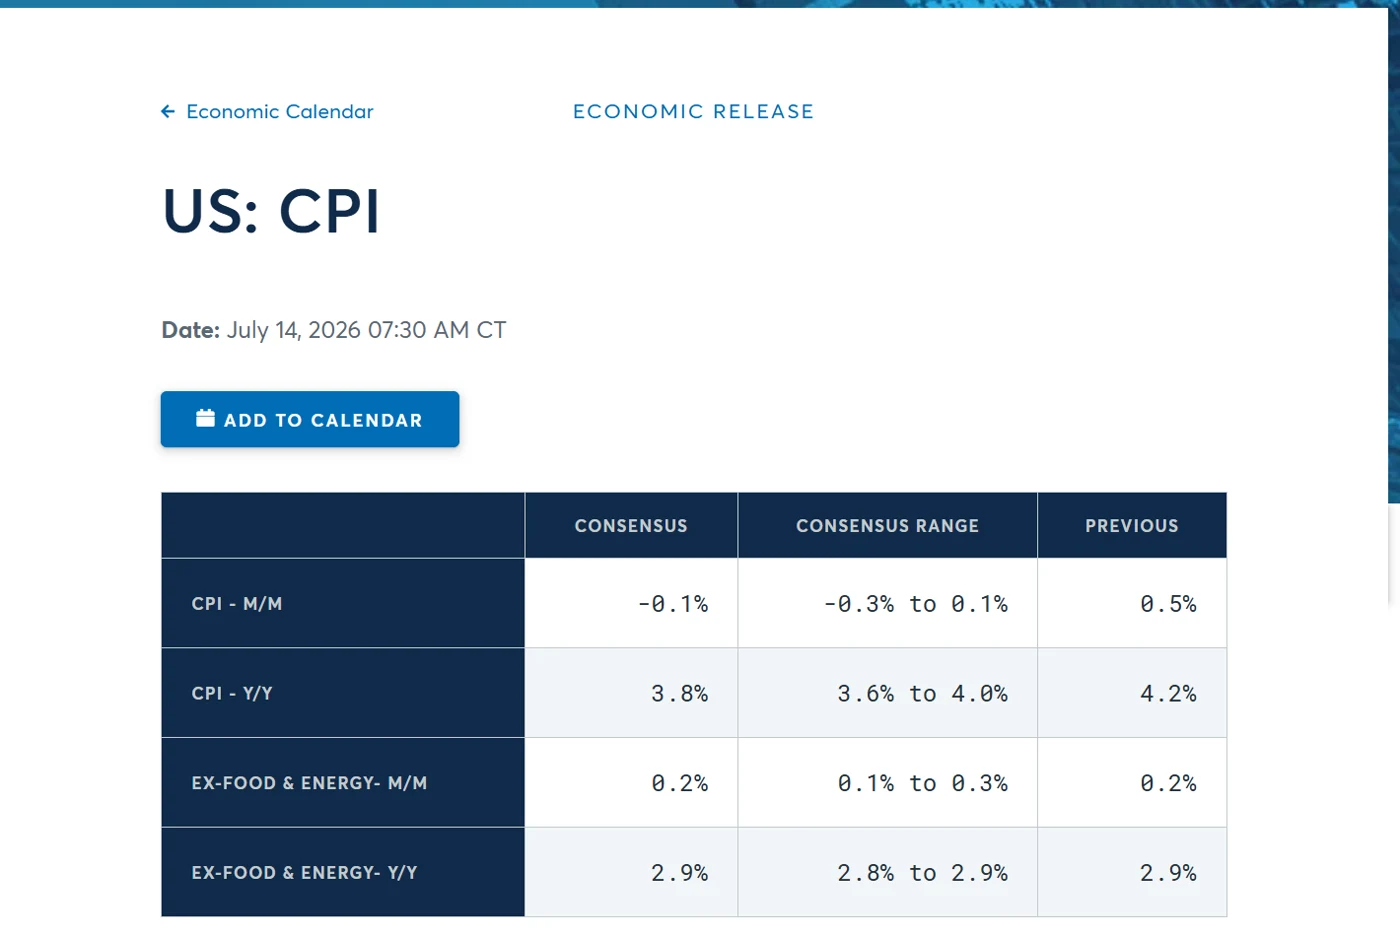
Market expectations before the release. The forecast is provided by a third-party source and is not official BLS data.
Real Example: US CPI on July 14, 2026
The US Consumer Price Index release on July 14, 2026 provides a clear real-world example of the full process.
Before the release, the calendars we captured showed the following expectations:
| CPI indicator | Forecast | Previous |
|---|---|---|
| Headline CPI MoM | -0.1% | 0.5% |
| Headline CPI YoY | 3.8% | 4.2% |
| Core CPI MoM | 0.2% | 0.2% |
| Core CPI YoY | 2.8% or 2.9% | 2.9% |
The difference in the final row is important. FinancialJuice and Forex Factory displayed a 2.8% forecast for Core CPI YoY, while CME Econoday displayed 2.9%. A forecast is not an official BLS value: it is a consensus assembled by a third-party provider, so different calendars can publish slightly different expectations.
At 8:30 a.m. Eastern Time, the Bureau of Labor Statistics published the June 2026 CPI report. The official release reported:
| CPI indicator | Reference forecast shown by FinancialJuice/Forex Factory | Actual | Surprise: Actual - Forecast |
|---|---|---|---|
| Headline CPI MoM | -0.1% | -0.4% | -0.3 percentage points |
| Headline CPI YoY | 3.8% | 3.5% | -0.3 percentage points |
| Core CPI MoM | 0.2% | 0.0% | -0.2 percentage points |
| Core CPI YoY | 2.8% | 2.6% | -0.2 percentage points |
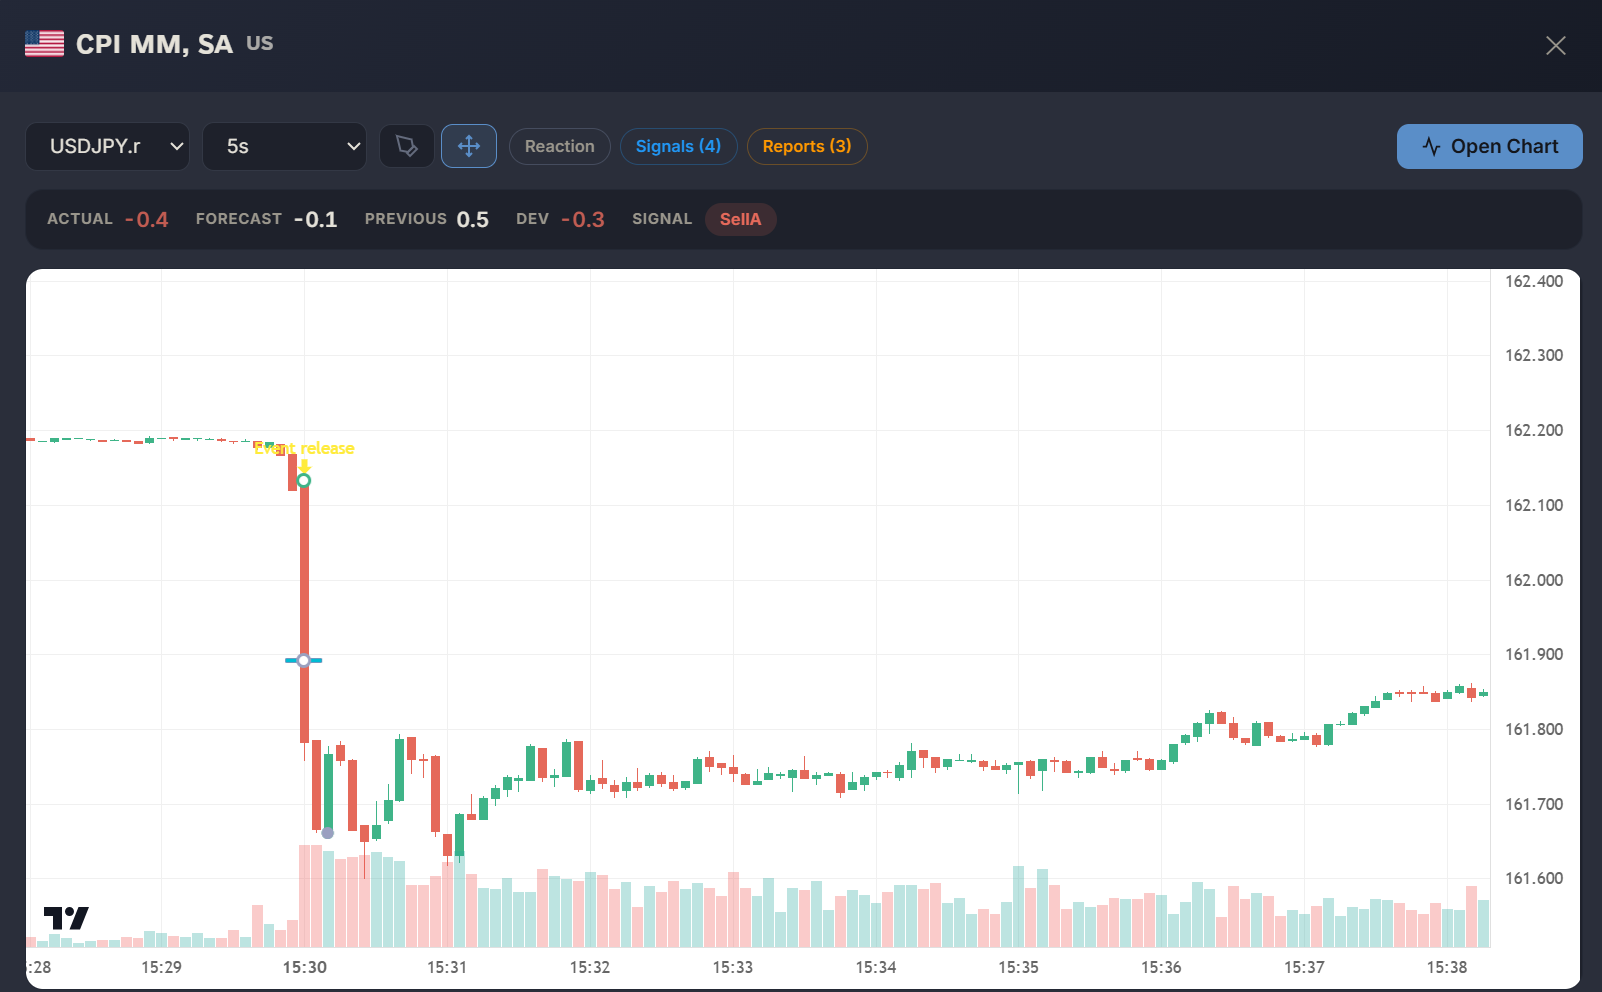
All four closely watched readings were below these reference forecasts. In this case, the headline and core figures did not create a directional data conflict. The recorded system view separately confirms the headline CPI MoM calculation: -0.4% Actual, -0.1% Forecast and a -0.3 percentage-point deviation.
The official BLS summary also showed that the all-items index declined 0.4% in June after increasing 0.5% in May. The energy index fell 5.7% during the month and was the largest contributor to the decline. The all-items index increased 3.5% over 12 months, while the index excluding food and energy increased 2.6%. See the official BLS CPI release.
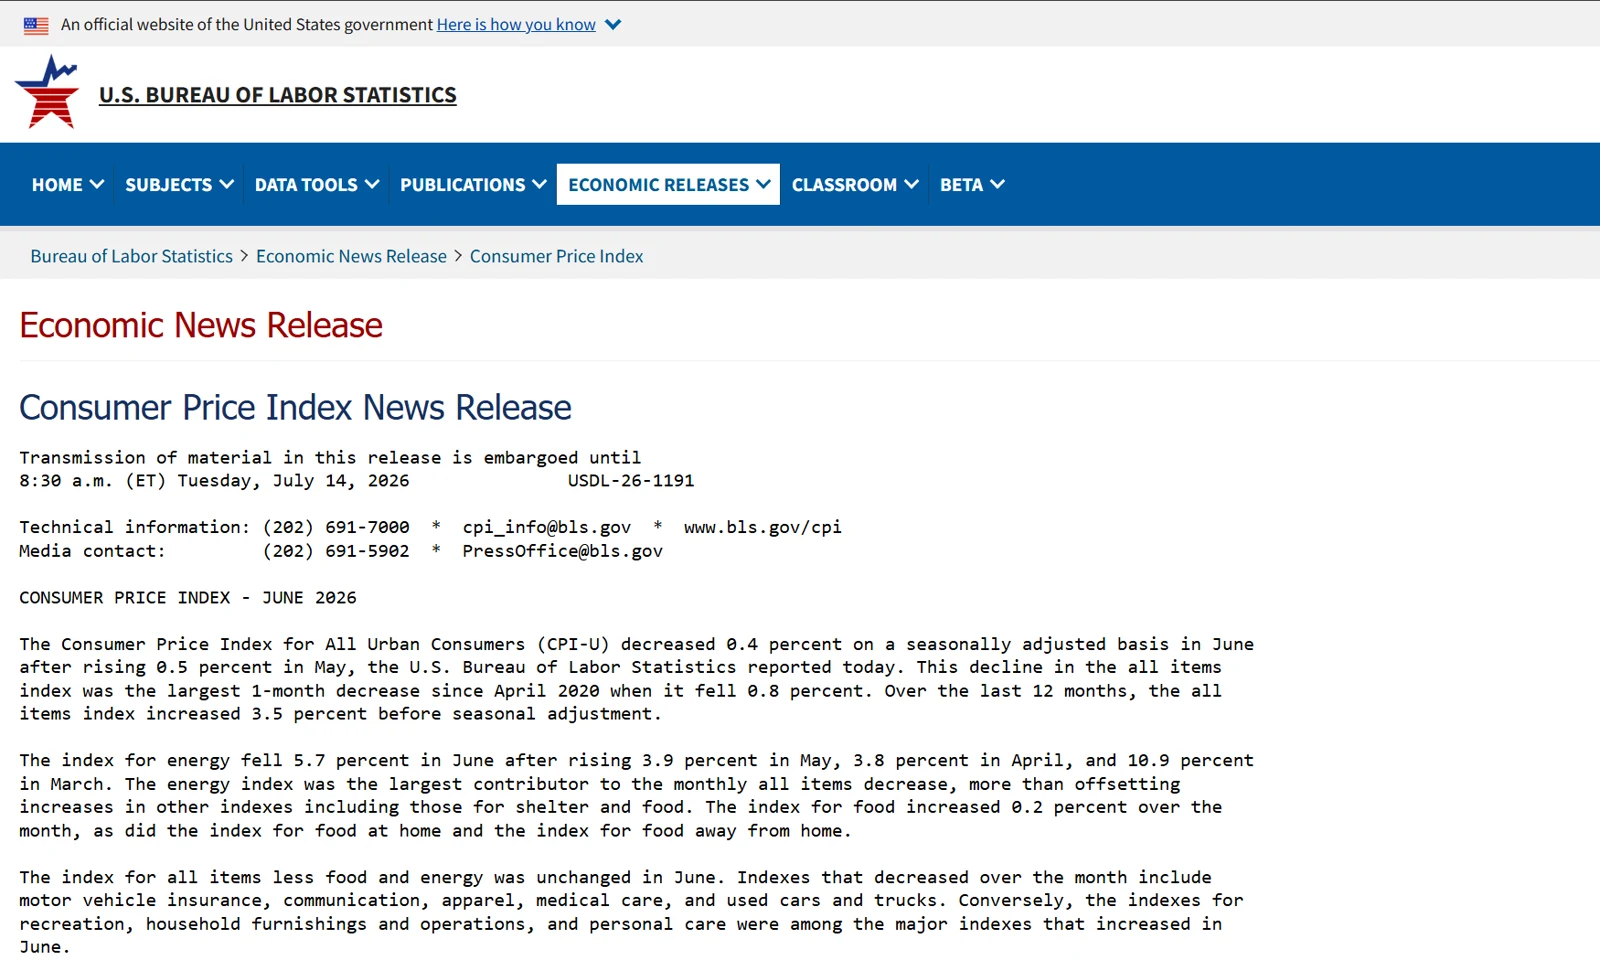
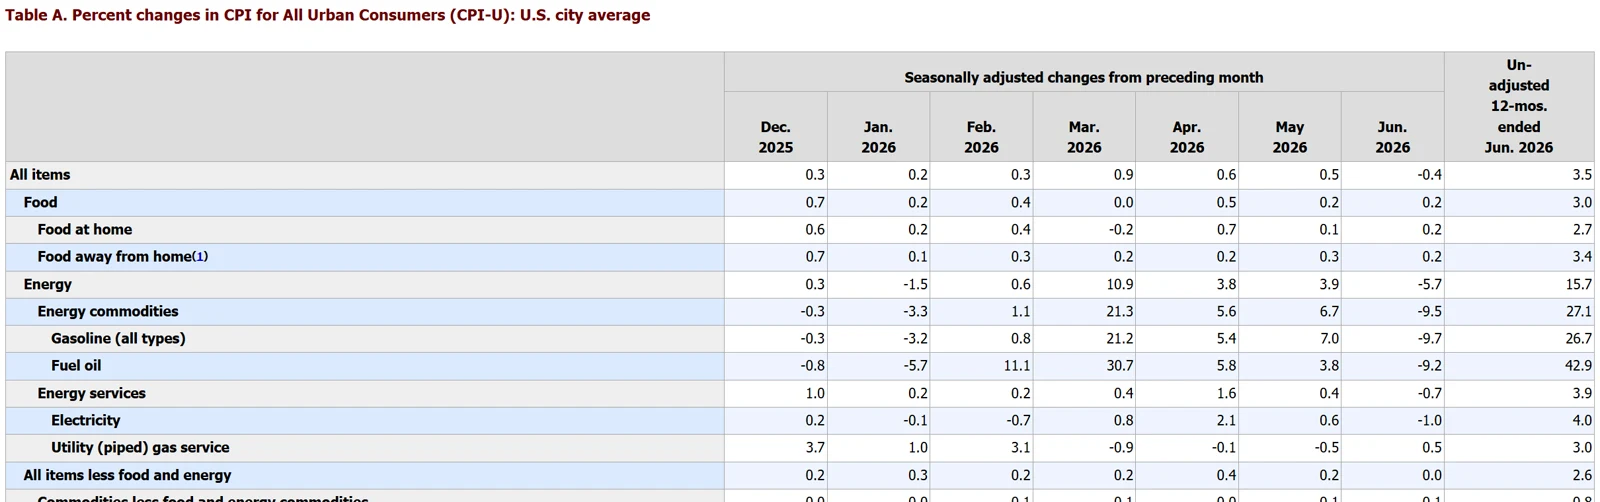
The official BLS publication is the source of the Actual values. Calendar forecasts shown before the release came from third-party providers.
The recorded XAUUSD chart shows an immediate upward move after this particular release. That observation does not mean that softer CPI always makes gold rise. It documents the reaction that occurred in this case.
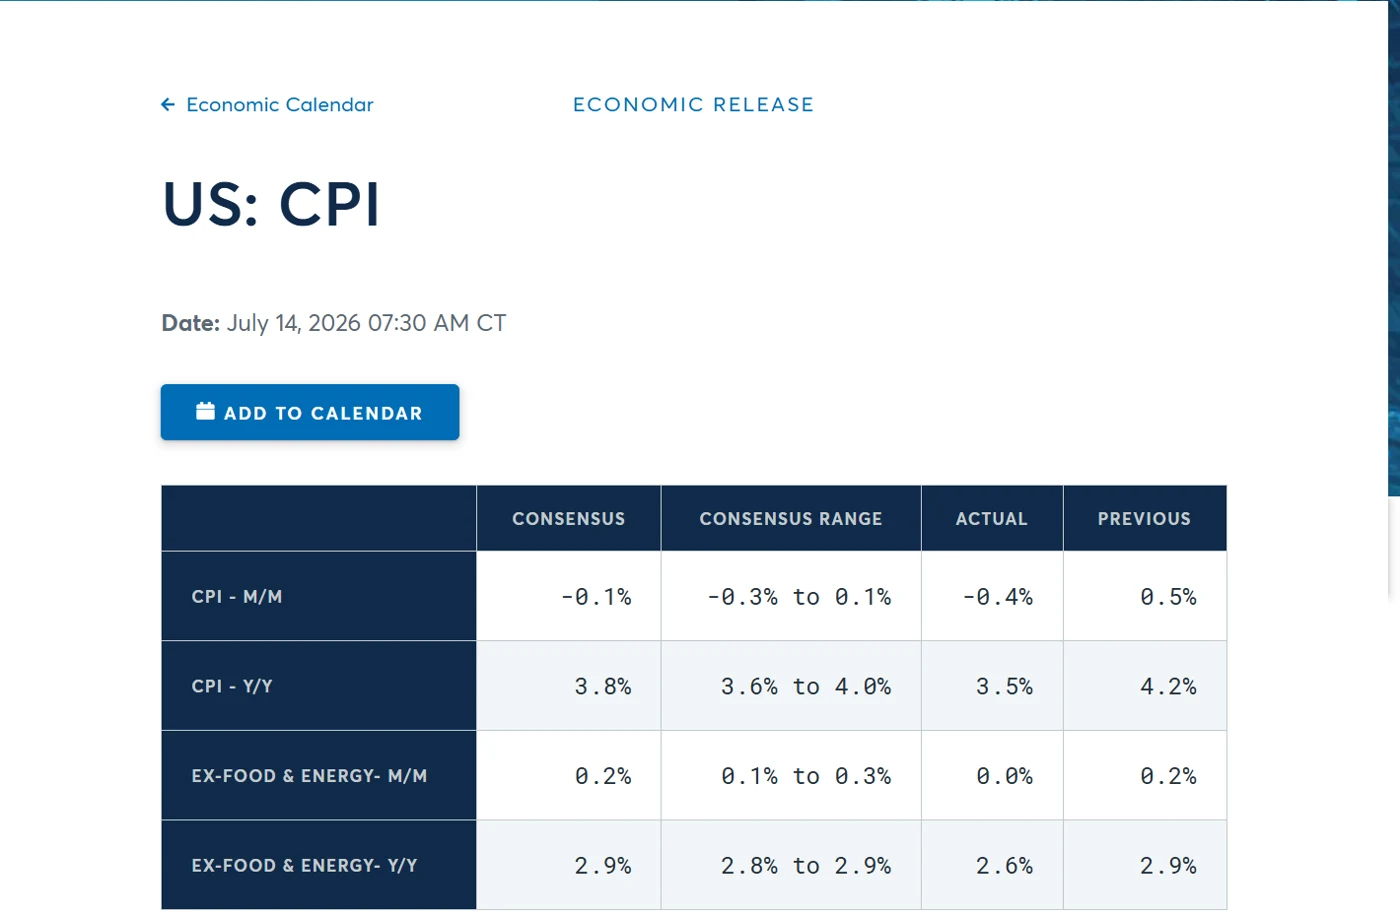
Forecast, Actual and Surprise for the four CPI readings. The values were directionally aligned rather than conflicting.
How Does a Release Become a Market Move?
When an official agency publishes a report, the first race begins: receiving and processing the data.
Before 2020, some US economic reports were provided in advance to accredited media representatives in dedicated lock-up rooms. Journalists could examine the material under embargo but were not permitted to transmit it before the scheduled release time.
On June 3, 2020, the US Department of Labor permanently discontinued prerelease media lock-ups. The stated purpose of the change was to provide simultaneous and equitable access to the media, commercial entities, and the general public. The data would instead be distributed through official websites and other channels at the scheduled release time. See the BLS explanation of the media lock-up change.
Market participants now compete to obtain the information as quickly as possible from the available channels.
Official websites can experience heavy demand during a major release.
The Complete Path from Release to Trade
1. Official Publication
A government agency publishes the report at a scheduled time. For example, the CPI case documented in this article was released by BLS at 8:30 a.m. Eastern Time on July 14, 2026.
At this stage, only the official figures exist. No trading decision has been made yet.
2. Data Arrives Through a News Feed
The news system receives the data from its source.
Delivery time depends on:
- the infrastructure of the official source;
- the news data provider;
- the network route;
- server location;
- the publication format;
- demand at the time of release.
A delay at this stage is not the same as broker execution latency. These are separate parts of the chain.
3. Parsing and Validating the Values
The received data must be parsed correctly and matched to the expected event.
The system must identify:
- the release name;
- the reporting period;
- Actual;
- Forecast;
- Previous;
- revisions;
- units of measurement;
- multiple indicators published within the same release.
4. Calculating the Surprise and Evaluating Triggers
After the data has been processed, the difference between the actual values and the forecast is calculated.
Reacting to that difference is one of several execution methods available around a release; how the methods compare sets threshold logic against pending stop orders and manual entries.
The system then evaluates the predefined conditions:
Actual significantly above Forecast → possible BUY or SELL
Actual significantly below Forecast → possible BUY or SELL
Deviation is insufficient → NO TRADE
Indicators contradict one another → CONFLICT
The direction depends on the event and the instrument. For example, higher inflation and higher employment have different economic implications even though both figures may be above forecast.
Triggers can be based on:
- historical market reactions;
- the size of the surprise;
- a combination of several indicators;
- revisions;
- the selected financial instrument.
PRO plan users can choose their own thresholds and conditions while accepting the risks associated with those settings. No trigger can guarantee an expected market move or an order fill.
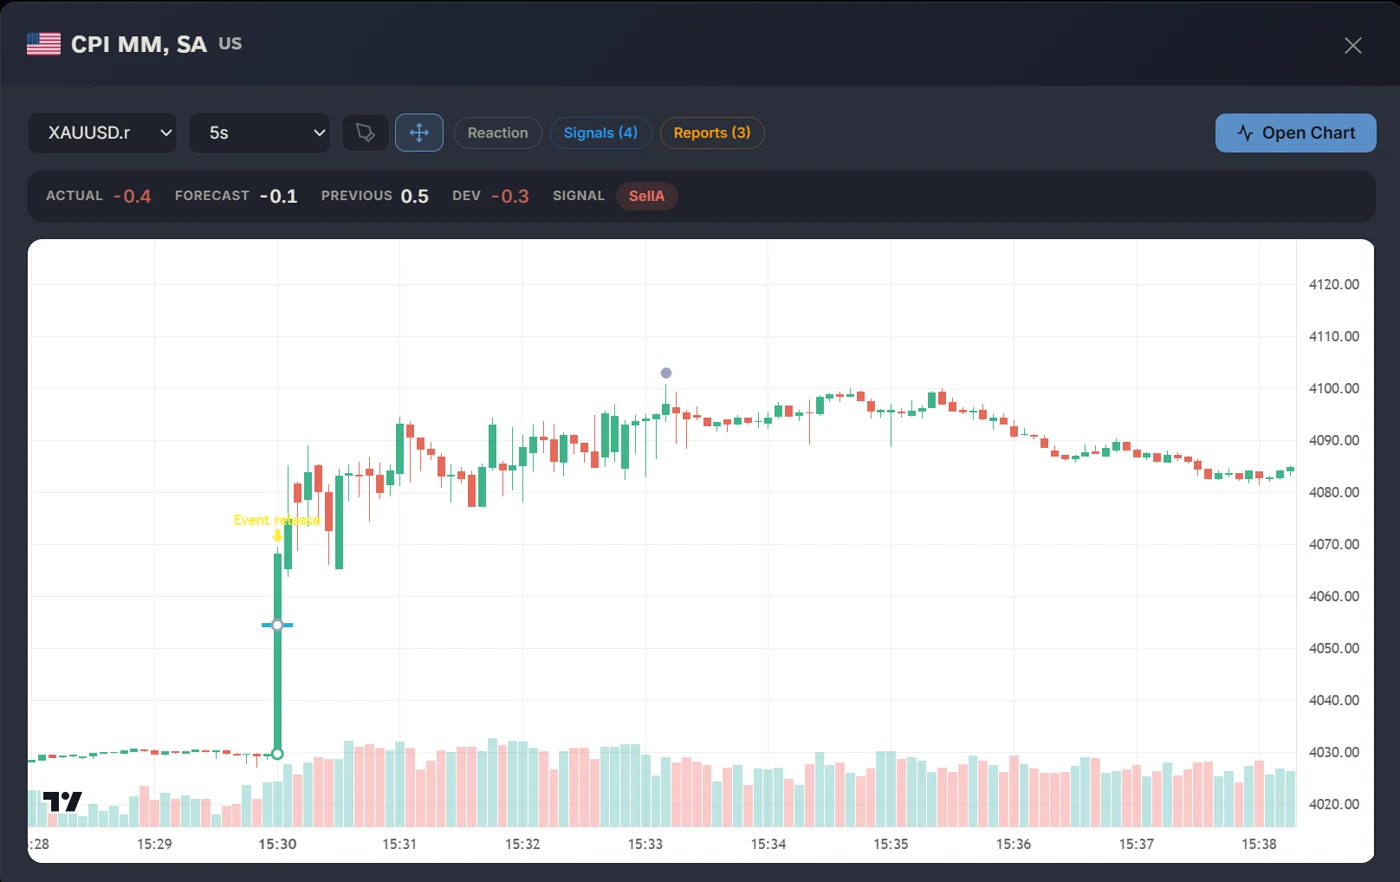
The system calculated a -0.3 percentage-point headline CPI MoM surprise. SellA represents the bearish USD macro signal; for the configured XAUUSD instrument, the corresponding order direction was BUY.
The Second Race: Sending the Order
If all conditions are satisfied, a second independent process begins: transmitting the trading order.
The order is sent through the trading account's platform to the broker's trading server. The broker then processes the request within its own infrastructure and returns the execution result. At this stage, what matters is not the name of the platform, but how quickly the request is processed and the actual conditions under which the order is filled or rejected.
After sending the request, the system waits for a response:
filled— the order was filled;partially filled— only part of the order was filled;rejected— the order was rejected;requote— a different price was offered;timeout— no response was received within the allowed time.
Why Might a Broker Fail to Fill an Order?
During a strong market move, liquidity near the current price may fall sharply. At the same time, the spread can widen and the available price can change.
A broker or its liquidity provider may:
- fill the order at the requested price;
- fill it with positive or negative slippage;
- fill only part of the requested volume;
- reject the order;
- return an error;
- fail to respond before the timeout expires.
Once the order has been transmitted, we do not control the internal infrastructure of the broker, bank, exchange, or liquidity provider. We can only measure when the request was sent, when the response was received, and the actual execution parameters.
One featured result from the CPI release contains a broker-confirmed gold trade. The broker identifies this instrument as GOLD#; other brokers may use names such as XAUUSD or add their own symbol suffixes.
| Recorded trade field | Value |
|---|---|
| Instrument | GOLD# |
| Direction | BUY |
| Volume | 0.95 lots |
| Open price | 4034.62 |
| Close price | 4057.68 |
| Gross P/L | +2,190.70 USD |
| Costs | 0.00 USD |
| Net P/L | +2,190.70 USD |
| Opened | 2026-07-14 15:30:02 broker/server time |
| Closed | 2026-07-14 15:30:03 broker/server time |
| Open fill latency | 153 ms |
| Broker ping | 1 ms |
| Open slippage | 96 points |
| Open spread | 45 points |
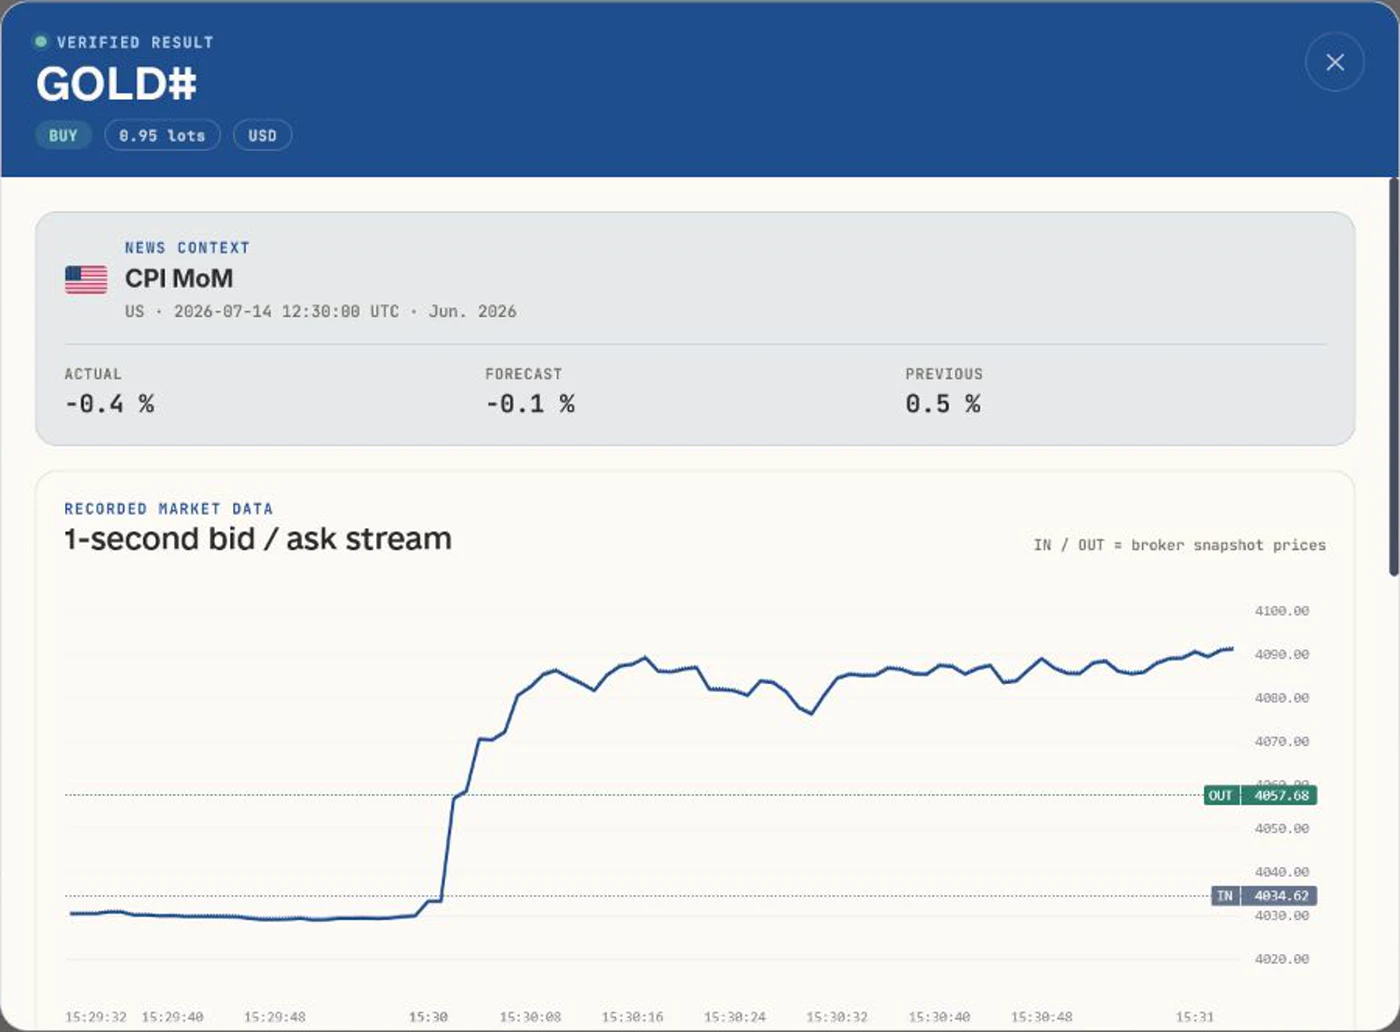
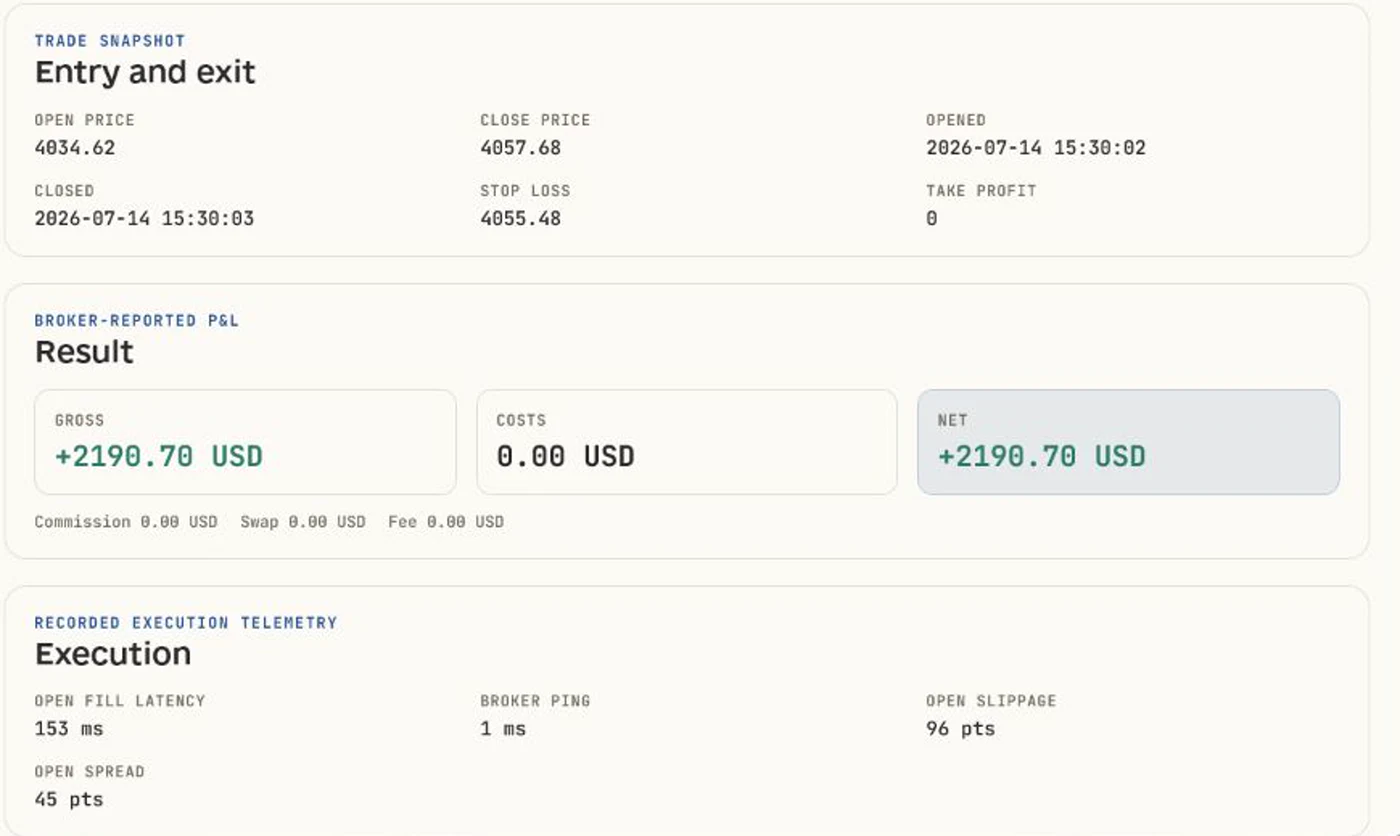
More events recorded the same way are published as verified news trading results, with the recording methodology describing what is captured and what it does not prove.
Featured verified result recorded for the July 14 CPI release. Account, broker and trader identity are not published. Trade timestamps are displayed in the broker/server time domain.
Ping, Execution Latency, and Slippage Are Not the Same
These metrics are often incorrectly treated as if they measure the same thing.
Ping is an approximate measurement of the network round trip to a server. It does not measure the complete processing of a trading order.
Execution latency is the time between sending an order and receiving its confirmed result.
Slippage is the difference between the requested price and the actual fill price.
A low ping does not guarantee fast or precise execution. The CPI result demonstrates the difference: broker ping was recorded at 1 ms, while the open fill latency was 153 ms. The same execution recorded 96 points of open slippage and a 45-point open spread. Network distance, broker processing time and the final fill price are related parts of execution, but they are not the same measurement.
For a practical comparison of locations, resources, prices, and measurement methods, read How to Choose a VPS for Low-Latency News Trading.
For this reason, several parameters must be recorded:
Order sent time
Broker response time
Requested price
Filled price
Spread
Slippage
Execution latency
Final status
How Long Does the Complete Process Take?
Individual internal operations, such as calculating the deviation or evaluating a simple condition, can take microseconds.
However, the complete path from official publication to confirmed execution must be measured across the entire chain:
Publication
→ data reception
→ parsing
→ trigger evaluation
→ order transmission
→ broker processing
→ execution confirmation
Depending on the source, network, and broker, this process can take anywhere from a few milliseconds to several seconds.
For this reason, the statement "execution in 1 ms" does not describe the entire system. It is necessary to specify which part of the process was measured and which timestamps were used to calculate the latency.
Execution Completes the Chain
The trading chain is complete only after confirmation has been received from the broker.
The result can then be stored together with the available telemetry:
- the event and reporting period;
- Actual, Forecast, and Previous;
- the time the data was received;
- trade direction;
- order transmission time;
- execution time;
- entry price;
- spread and slippage;
- closing time;
- the final result reported by the broker.
For the July 14 CPI example, the stored result connects the four elements that matter for later review: the exact calendar release, the values received, the recorded market reaction, and the broker-confirmed trade. The featured GOLD# order opened at 4034.62 and closed at 4057.68. On 0.95 lots, the broker reported gross and net P/L of +2,190.70 USD with 0.00 USD recorded costs.
Storing this information does not make the result repeatable and does not guarantee similar execution in the future. It only makes it possible to verify what happened in that specific case.
What Can Go Wrong?
Macro news trading involves elevated technical and market risk:
- a release may contain conflicting indicators;
- values may be parsed incorrectly;
- the official source or news feed may be delayed;
- the spread may widen sharply;
- the price may jump across the selected level;
- the order may be rejected;
- execution may occur with substantial slippage;
- the market may reverse after the initial move;
- the connection to the broker may be lost;
- different brokers may provide different prices and execution results.
Correctly interpreting the direction of a news surprise does not guarantee a profitable trade.
Conclusion
Macro news trading is not simply an attempt to press BUY or SELL after a number appears in an economic calendar.
It is a sequence of independent stages:
- A government agency publishes the data.
- The news infrastructure receives the release.
- The system parses and validates the values.
- The deviation from the forecast is calculated.
- The trading conditions are evaluated.
- The order is transmitted to the broker.
- The broker or liquidity provider fills or rejects it.
- The actual execution and telemetry are stored for subsequent analysis.
Speed matters at every stage, but speed alone guarantees nothing. Data accuracy, trigger logic, market conditions, and actual execution quality are equally important.
Continue Reading
- Compare VPS locations and costs in How to Choose a VPS for Low-Latency News Trading.
- Review the VPS and execution latency methodology.
- Read the ToxicTraders risk disclosure, or return to the platform overview.
This material is provided for educational purposes and is based on practical experience and observation. It is not investment advice, a trading signal, or a promise of financial performance. Trading during macroeconomic releases involves a heightened risk of loss.